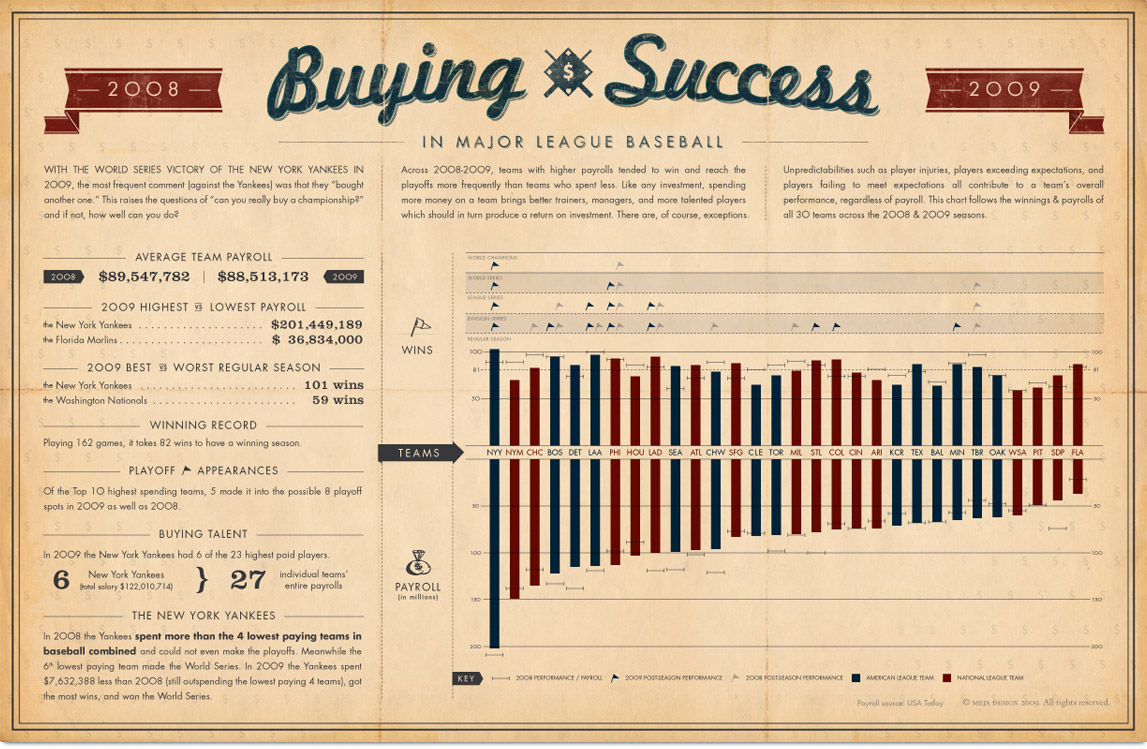
With the World Series victory of the New York Yankees in 2009, the most frequent comment (against the Yankees) was that they “bought another one.” This raises the question of “can you really buy a championship?” and if not, how well can you do?
The first poster follows the winnings & payrolls of all 30 teams across the 2008 & 2009 seasons to see if it really is possible to buy success. The result is that, while the teams who spent more tended to do better, it still does not guarantee a play-off spot and especially not a World Series title.
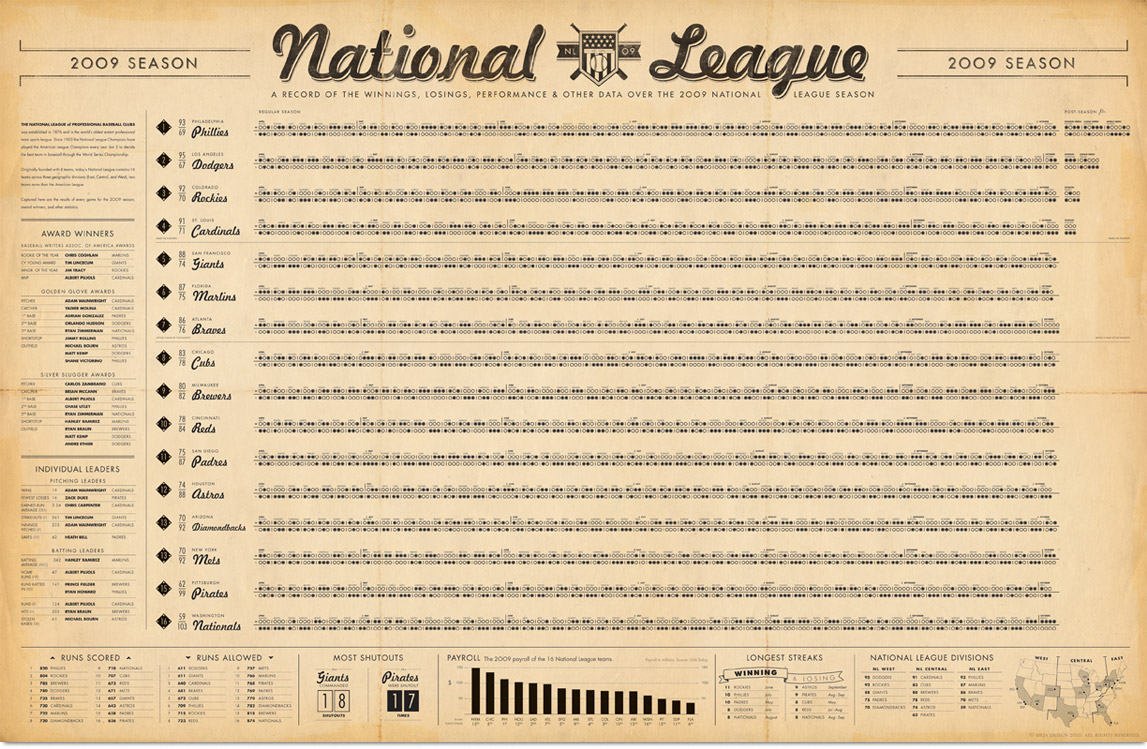
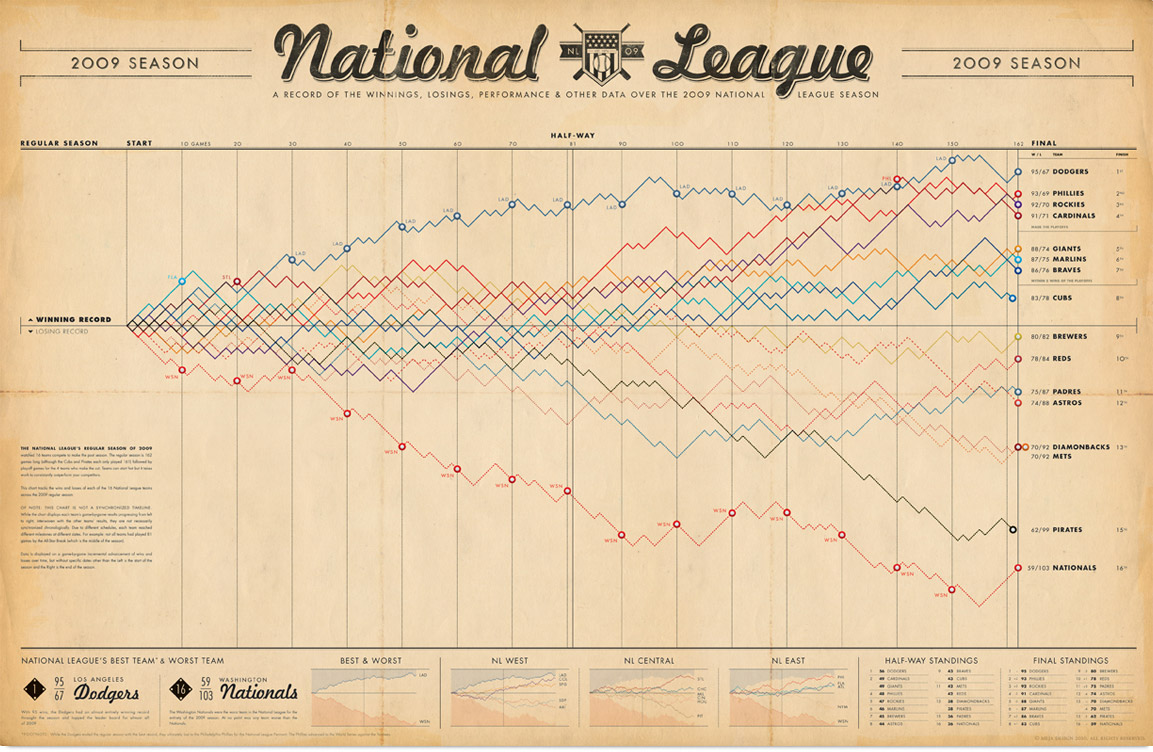
The following two posters track the results of every game of the 2009 National League Season. It tracks wins and losses of each team as well as calling out other related statistics and achievements hidden in the data.
The second poster uses a system of dots to show wins & losses as well as keeping track of each series opponent. The third poster depicts each team’s regular season as a line with wins and losses visualized as incremental advances up or down which helps to contextually build relationships between the 16 different teams’ collective successes and failures.